Introduction
Since EarthDataVis requires YAXArrays and GLMakie, we also install those and start using them as follows:
using EarthDataVis, GLMakie
using YAXArrays, Dates, Colors
GLMakie.activate!()
Then, first let's start by creating some test data for EDV.
dates = Date(2021, 1, 1):Day(1):Date(2021, 1, 31)
axlist = [
    RangeAxis("time", dates),
    RangeAxis("lon", range(1, 10, length=15)),
    RangeAxis("lat", range(1, 15, length=20)),
    CategoricalAxis("Variable", ["var1", "var2"])]
data = rand(length(dates), 15, 20, 2)
dsarr = YAXArray(axlist, data)
YAXArray with the following dimensions
time                Axis with 31 Elements from 2021-01-01 to 2021-01-31
lon                 Axis with 15 Elements from 1.0 to 10.0
lat                 Axis with 20 Elements from 1.0 to 15.0
Variable            Axis with 2 elements: var1 var2
Total size: 145.31 KB
And plotting our first cube is done with
plotcube(dsarr; kind=:voxel, colormap=:linear_bmy_10_95_c71_n256)
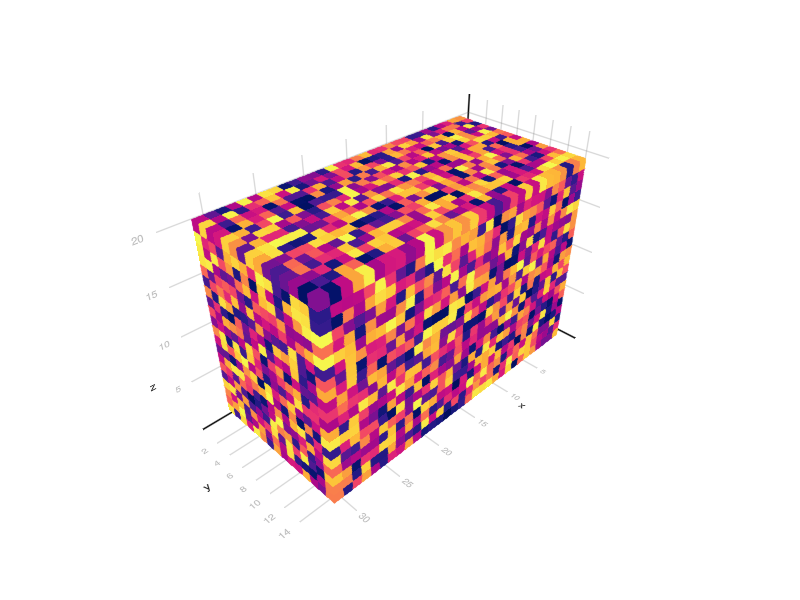
using plotcube will generate a cube for one of the variables in dsarr. Note that different options are available. We will take a look at one of them.
This page was generated using Literate.jl.